Debugging code in App Builder project
Use the local environment to simulate and troubleshoot your Adobe I/O App Builder code before deploying.
Debugging web actions with Adobe Commerce as a Cloud Service or a deployed instance is not supported. They can only be simulated locally.
Prerequisites
Set require-adobe-auth: false and web: 'yes' in the app-config.yaml file when debugging runtime actions.
Configure the debugger
To debug your Adobe I/O App Builder project in Visual Studio Code (VS Code), set up a launch configuration. This allows you to run and debug your app directly from VS Code, making it easier to inspect code, set breakpoints, and view logs.
Create a
.vscodefolder in the root of your project if one does not already exist. Inside this folder, create or edit thelaunch.jsonfile.Copy and paste the recommended content from debugging with VS Code.
Save your changes.
This configuration sets up the VS Code debugger to work with Adobe I/O App Builder projects.
Enable source maps
In the root folder of your project, create a webpack-config.js file with the following content:
Copied to your clipboardmodule.exports = {devtool: 'inline-source-map'}
Rebuild the project
Use the following command to rebuild your project to apply the changes.
Copied to your clipboardaio app build
Start debugging
To start debugging your action code:
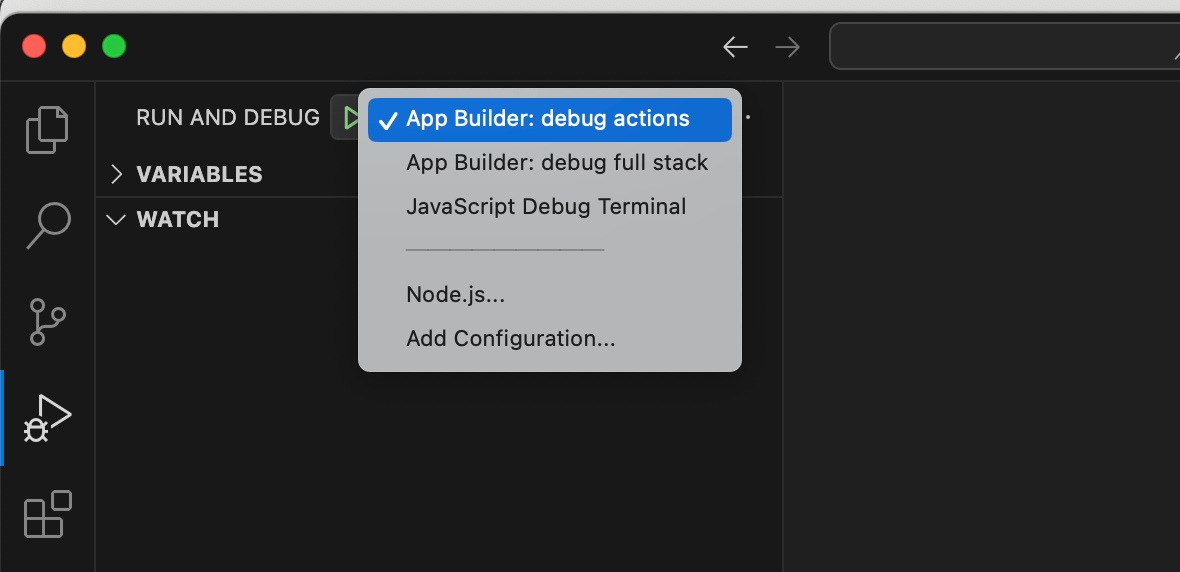
In VS Code, on the Run and Debug tab, select the launch configuration you created in "Configure the debugger". This will allow you to run your app in debug mode.

Click the Run button or press F5 to start the debugger. This starts the app using the
aio app devcommand. Output similar to the following is displayed in the terminal:Copied to your clipboardDebugger attached.Building the app...To view your local application:-> https://localhost:9080To view your deployed application in the Experience Cloud shell:-> https://experience.adobe.com/?devMode=true#/custom-apps/?localDevUrl=https://localhost:9080Your actions:web actions:-> https://https://localhost:9080/api/v1/web/{your-project-name}/{name-of-your-action}non-web actions:press CTRL+C to terminate the dev environment2025-05-22T06:41:55.969Z [watcher] info: watching action files at...
Invoke an action with a sample payload
Now that your local debugger is running, you can test your web action by sending a request to the local endpoint. Use tools like Postman or any other API client to send a POST request to the listed URL, such as https://localhost:9080/api/v1/web/{your-project-name}/{name-of-your-action}, with the sample JSON payload.
Copied to your clipboard{"specversion": "1.0","id": "23f76cef-9f14-44b1-bbd0-29995789c98e","source": "urn:uuid:fb58963f-d2e7-4ab4-83da-b6ff15b8ebc0","type": "com.adobe.commerce.observer.catalog_product_save_commit_after","datacontenttype": "application/json","time": "2025-07-17T15:48:42.436Z","eventid": "b0f2b088-5490-4d16-9ce9-0cb1fb3e5ed0","event_id": "b0f2b088-5490-4d16-9ce9-0cb1fb3e5ed0","recipient_client_id": "ca7b36f23be94dcb9d2ebb97f0276e3f","recipientclientid": "ca7b36f23be94dcb9d2ebb97f0276e3f","data": {"key": "31a86bbd-e51d-4b58-9f5a-34ec8df263c9","value": {"sku": "eventtest1","name": "eventtest r","created_at": "2025-06-20 15:32:20","updated_at": "2025-07-17 15:48:41","stock_data": {"qty": "65"},"price": "32444.000000"},"source": "<eventprovider>.Stage","_metadata": {"commerceEdition": "Adobe Commerce","commerceVersion": "1.0.0-beta","eventsClientVersion": "1.12.1","storeId": "0","websiteId": "0","storeGroupId": "0"}}}
The request should trigger the web action and hit the breakpoint you set earlier in your code, allowing you to inspect the incoming payload and debug the action logic.
Test using curl
You can also test your web action using curl from the command line. Use the following command, replacing the URL with your local endpoint:
Copied to your clipboardcurl --insecure --request POST \--url https://localhost:9080/api/v1/web/<your-project-name>/{name-of-your-action}} \--header 'Content-Type: application/json' \--header 'User-Agent: insomnia/10.1.1-adobe' \--data '{"specversion":"1.0","id":"23f76cef-9f14-44b1-bbd0-29995789c98e","source":"urn:uuid:fb58963f-d2e7-4ab4-83da-b6ff15b8ebc0","type":"com.adobe.commerce.observer.catalog_product_save_commit_after","datacontenttype":"application/json","time":"2025-07-17T15:48:42.436Z","eventid":"b0f2b088-5490-4d16-9ce9-0cb1fb3e5ed0","event_id":"b0f2b088-5490-4d16-9ce9-0cb1fb3e5ed0","recipient_client_id":"ca7b36f23be94dcb9d2ebb97f0276e3f","recipientclientid":"ca7b36f23be94dcb9d2ebb97f0276e3f","data":{"key":"31a86bbd-e51d-4b58-9f5a-34ec8df263c9","value":{"sku":"eventtest1","name":"eventtest r","created_at":"2025-06-20 15:32:20","updated_at":"2025-07-17 15:48:41","stock_data":{"qty":"65"},"price":"32444.000000"},"source":"eventprovider","_metadata":{"commerceEdition":"Adobe Commerce","commerceVersion":"1.0.0-beta","eventsClientVersion":"1.12.1","storeId":"0","websiteId":"0","storeGroupId":"0"}}}'
Tips For app development
These tips will help you streamline development and improve reliability while building event-driven applications using Adobe App Builder.
Redeploy changes
If you've made changes to the action code, run the below commands:
Copied to your clipboardaio app buildIf you have multiple actions in your project and want to deploy only a specific action you modified, run the following command to rebuild and redeploy only the specified action.
Copied to your clipboardaio app deploy --action=testevent
Debugging action failures
When an App Builder action fails, you can debug it using either the Debug Tracer in Developer Console or the CLI activation commands.
Using a debug tracer (UI)
You can use the Debug Tracer in the Adobe Developer Console to quickly identify issues with your action code.
Open the project in Adobe Developer Console.
Go to the Debug Tracer tab.
Trigger your action (e.g.,
aio app deployoraio runtime action invoke <namespace>/<package>/<actionName>).
If the action fails, Debug Tracer shows:
- The Activation ID (unique execution ID)
- The Error response from the runtime (e.g.,
application error,server error,401 unauthorized,403 forbidden, etc.) - Any
logger.info/logger.errormessages the code emitted
Example Debug tracer error:
Copied to your clipboardapplication error{"error": "server error"}
You can copy the Activation ID directly from Debug Tracer to investigate further using the CLI.
Using the CLI
To get more details, activation commands can be used.
Copied to your clipboardaio rt activation listDatetime Status Kind Version Activation ID─────────────── ───────── ───────── ───────── ────────────────────────────────08/13 20:32:24 app error sequence 0.0.1 7d2470aa1bc84bc6a470aa1bc85bc67c journalevent/eventjournal
The last column shows the Activation ID.
To get logs explicitly
Copied to your clipboardaio rt activation logs <ACTIVATION_ID>
Start with Debug Tracer for quick troubleshooting.
If you need more details (like raw JSON response, timing, annotations, logs), switch to the CLI with the Activation ID.
Interpreting event delivery logs in Adobe I/O Events
When an event is triggered and delivered through Adobe I/O Events, you can inspect the delivery status using the Debug Tracer in the Adobe Developer Console. The delivery record contains the following fields:
DELIVERY TIME (UTC): Timestamp when the event delivery was attempted.
EVENT CODE: Unique identifier representing the event type triggered
EVENT PROVIDER: Name of the configured provider in Adobe Commerce
RESPONSE CODE: HTTP response code returned by the Runtime action.
Use the Adobe I/O Events Tracing Guide to interpret these response codes and troubleshoot event delivery issues.